
Figure 9.
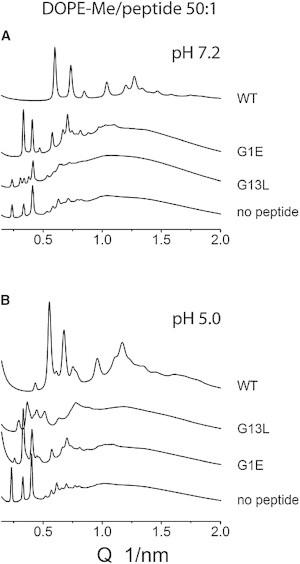
Comparison of XRD patterns recorded at 20°C from DOPE-Me/fusion peptide (50:1) mixtures after heating-cooling scans. (A) pH 7.2; (B) pH 5.0. The lattice constants of the cubic phases are summarized in Table 1.
Official websites use .gov
A
.gov website belongs to an official
government organization in the United States.
Secure .gov websites use HTTPS
A lock (
) or https:// means you've safely
connected to the .gov website. Share sensitive
information only on official, secure websites.
Comparison of XRD patterns recorded at 20°C from DOPE-Me/fusion peptide (50:1) mixtures after heating-cooling scans. (A) pH 7.2; (B) pH 5.0. The lattice constants of the cubic phases are summarized in Table 1.