
Figure 3.
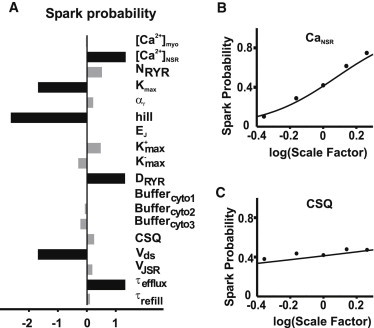
(A) Parameter sensitivity on Ca2+ spark probability performed by logistic regression analysis. (B) Spark probabilities by stochastic simulation results (dots) are compared to prediction curves of logistic regression (solid line) with changes in (B) CaNSR and (C) CSQ.