
Figure 5.
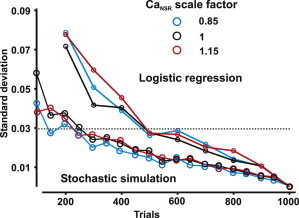
Relation between variability in Ca2+ spark probability calculation and number of simulations. Three scale factors (0.85, 1, 1.15) in CaNSR were used for both logistic regression analysis and stochastic simulation with varying trial number. At each trial number, the standard deviation was calculated for both methods. The standard deviation of the predictions decreases with an increase in the number of simulations.