
Figure 2.
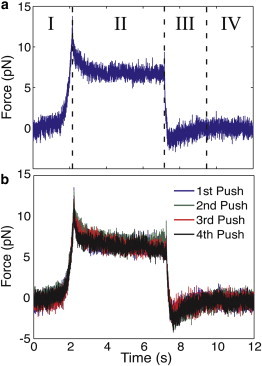
(a) A typical force curve from the optical force probe assay. In stage I, the dynamic force, Fdyn, is measured as the bead is pushed into the cell coat. During stage II, the force decays to a nonzero equilibrium force, Feq, while the bead motion pauses for 5 s at a distance of 3 μm from the cell’s surface. Stage III shows the dynamic force on the bead as it is retracted. Stage IV shows the force on the bead when it is at rest, outside of the matrix. (b) A comparison of consecutive optical force probe assays (stages I–IV) reveals no significant alteration in the force curves.