
Figure 3.
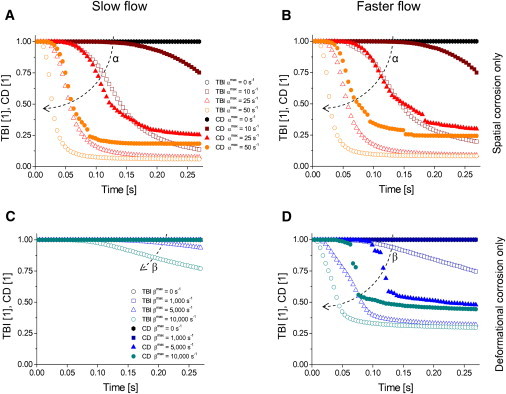
TBI curves (open symbols) and the corresponding CD curves (solid symbols) with slow (A and C) and faster (B and D) plasma flow and with either spatial corrosion only (A and B) or deformational corrosion only (C and D). Each leap in CD curves is associated with removal of one or more larger fragments from the clot. Dashed arrows indicate an increasing trend of corrosion parameters.