
Figure 5.
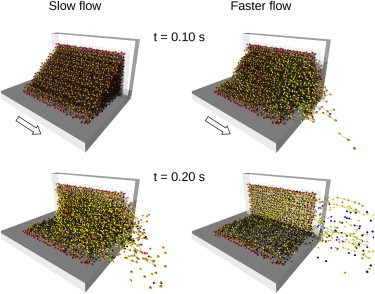
Snapshots of the three-dimensional blood clot assembly during its dissolution with slow and faster plasma flow at two selected simulation times (t = 0.1 and 0.2 s). The total number of removed clot fragments, as well as their average size, increased with increased plasma flow velocities. Individual bonds in partially dissolved clot fragments can be seen clearly in simulations with both plasma flow regimes. Some of the removed clot fragments are not visible, as they traveled out of the selected field of view.