
Figure 1.
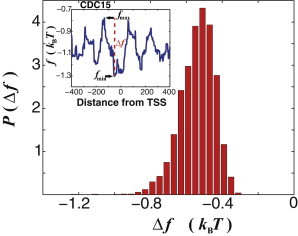
Nonconsensus protein-DNA binding free energy is statistically reduced in the yeast promoter regions. Computed probability distribution, , of the free-energy difference per basepair, , for each transcript from Rhee and Pugh (4), where and are the minimal and the maximal free energy values, respectively, in the interval around the TSS, where we defined, , and we used M = 8. is computed based on 6045 transcripts from Rhee and Pugh (4). The average value, . (Inset) Example of the computed free-energy profile, , for the CDC15 gene, with the definitions of , , and .