
Figure 5.
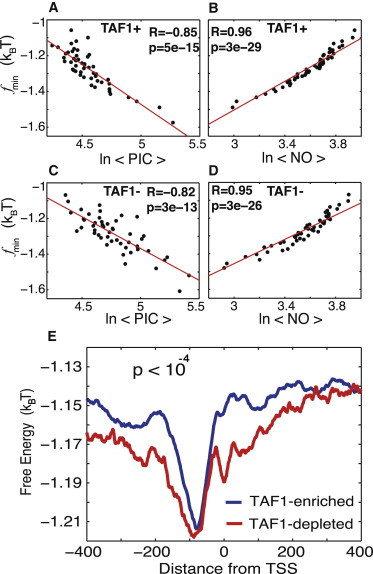
Statistical PIC binding preferences to both TFIID-dominated and SAGA-dominated genes negatively correlate with the nonconsensus free-energy landscape, yet these two groups of genes are distinguishable based on the average free-energy profiles. (A) Correlation between the minimal value of the free energy of nonconsensus TF-DNA binding, , and the average GTF occupancy of 3068 TAF1-enriched genes. The correlation is computed for individual genes in nonoverlapping windows of 80 bp within the entire interval around the TSS. The data are then sorted into 50 bins. (B) Similar to A, but with correlated with the nucleosome occupancy of these TAF1-enriched genes. (C) Correlation between and the average GTF occupancy of 877 TAF1-depleted genes. The correlation is computed for individual genes in nonoverlapping windows of 80 bp within the entire interval around the TSS. The data are sorted into 50 bins. (D) Similar to C, but now is correlated with the nucleosome occupancy of these TAF1-depleted genes. (E) The average free energy of nonconsensus TF-DNA binding per bp, , for a larger set of 4755 TAF1-enriched genes, and 1135 TAF1-depleted genes, around the TSSs.