
Figure 6.
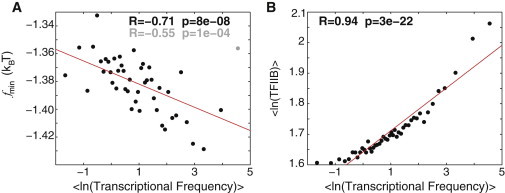
Nonconsensus TF-DNA binding influences transcriptional frequency genome-wide. (A) Correlation between the minimal value of the free energy of nonconsensus TF-DNA binding, , and the transcriptional frequency from Holstege et al. (6), computed for 3811 genes. For each gene, is computed in the interval around the TSS. The data are binned into 45 bins, ordered by the magnitude of transcriptional frequency. The outlier point corresponding to the highest-frequency bin is shown in gray. Removing this point significantly improves the correlation coefficient. (B) Correlation between the experimentally measured (4) peak occupancy of TFIIB in the promoter region and the transcriptional frequency for these 3811 genes.