
Figure 7.
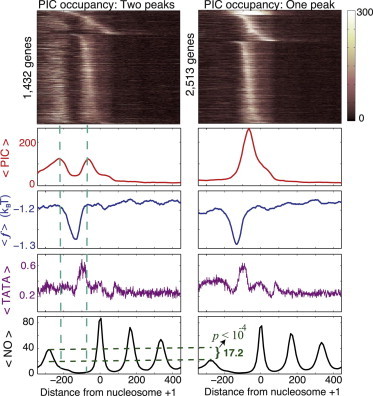
Nucleosomes flanking the upstream promoter region influence PIC occupancy. Specific binding of the PIC components to the −1 nucleosome might be responsible for the emergence of a secondary peak in the PIC occupancy profiles. (Left, top to bottom) The heat map represents the combined occupancy of the GTFs (referred to here as PIC occupancy) in the genes selected with a condition of the existence of a second peak in the combined GTF occupancy per gene, as measured in Rhee and Pugh (4). Only the genes with an absolute upstream peak occupancy >40 (in the occupancy-score units used in Rhee and Pugh (4)), and with a value of at least 50%, as compared with the downstream peak occupancy, were selected. As a result, 1432 double-peak (left) and the remaining 2513 single-peak (right) genes were selected. The next graphs represent (top to bottom) the average combined occupancy of the GTFs, ; the average free energy of nonconsensus TF-DNA binding per basepair, ; the average TATA-like box occupancy score (Materials and Methods); and the average nucleosome occupancy, . (Right) Analogous graphs for the remaining 2513 single-peak genes. The lower right graph shows the absolute difference between the average, maximal values of the −1 nucleosome occupancy for the double-peak and single-peak groups, as well as the computed p-value for this difference.