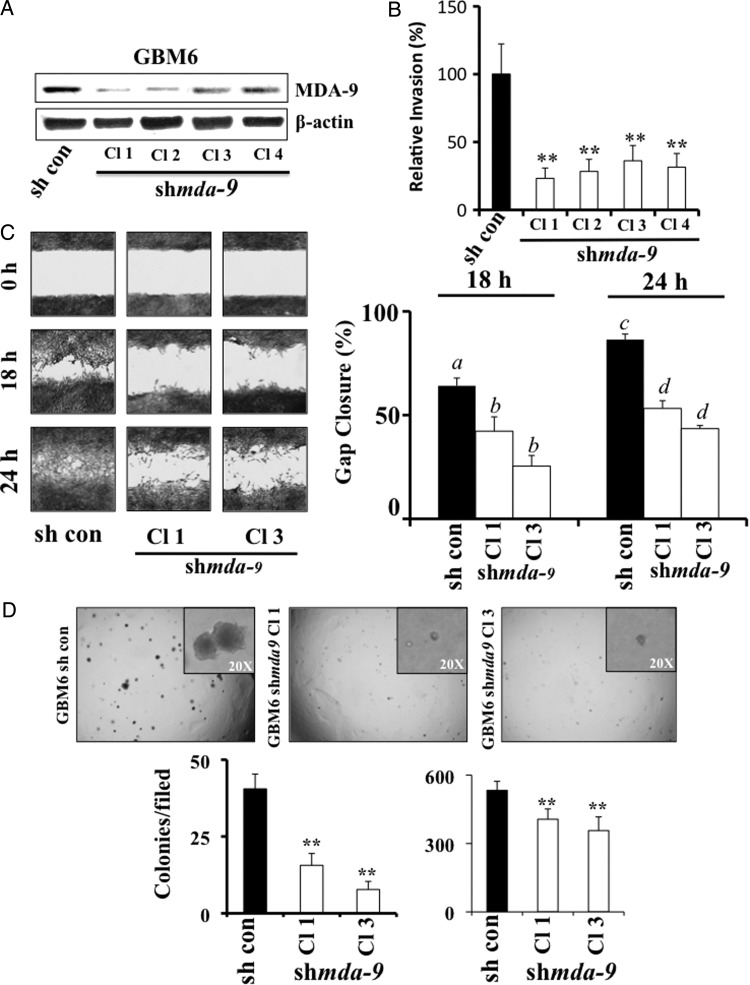
Fig. 4.
Stable MDA-9/syntenin knockdown in GBM results in decreased invasion, migration, and anchorage-independent growth. (A) MDA-9/syntenin protein levels were decreased by stable expression of shmda-9 in GBM6 cells. (B) Results from Matrigel invasion of GBM6–shmda-9 clones. Invasion quantified using 5 fields per triplicate well. (C) (Left) Wound healing assay after 18 and 24 h in control and shmda-9 GBM6 Cl 1 and Cl 3. (Right) Quantification of triplicate wound healing scratch assays as quantified using ImageJ. a differs from b (P < .01), and c differs from d (P < .01). (D) (Upper) Representative images of anchorage-independent growth in soft agar using GMB6-control and shmda-9 clones. (Inset) Higher magnification illustrating the differences in colony size. (Lower) Quantification of colony number (left) and size (right) using ImageJ. ** P < .01.

