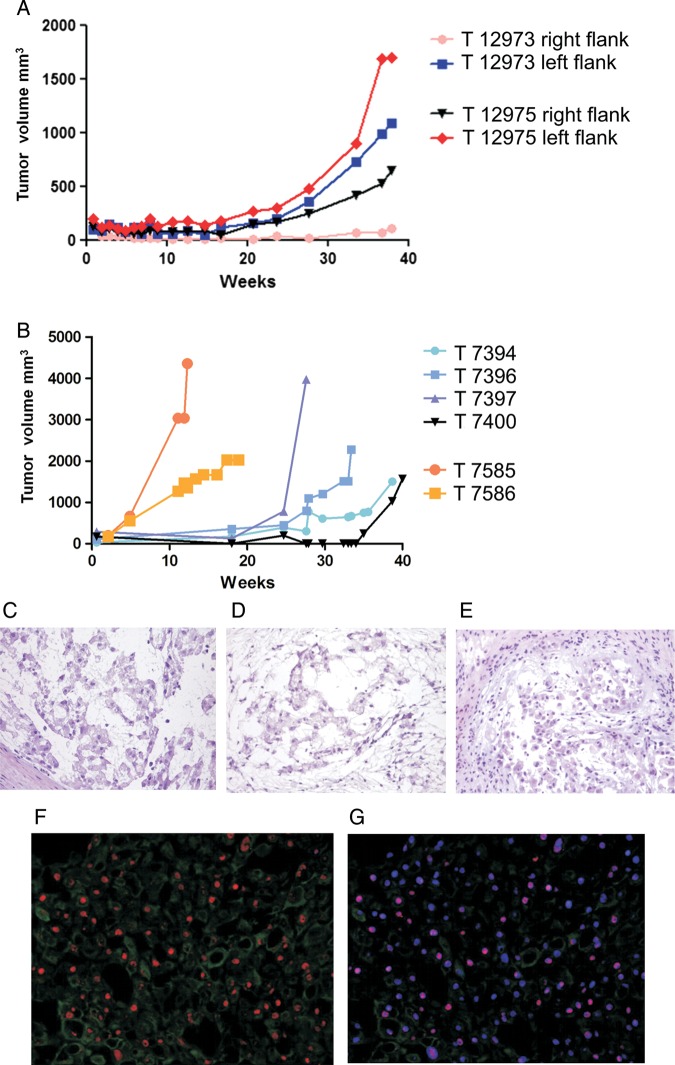
Fig. 1.
Growth curves of the chordoma xenograft derived from patient 5. (A) Four fragments were injected into the right and left flanks of 2 CD-1 nu/nu mice (T12973 and T12975). Three of the 4 fragments became visible after ∼25 weeks (5 months) and were explanted after 40 weeks (8 months). (B) Faster growth and larger volumes were observed during the third (25–40 weeks, T7394, T7396, T7397 and T7400) and fourth passages (10–20 weeks, T7585 and T7586). Morphology (H&E staining) of the human sample implanted in mouse (C) and the xenografts at passage 1 (D) and 4 (E). (F) Brachyury (red signal) and CAM5.2 (green signal) in the T12973 chordoma xenograft. (G) Counterstaining with DAPI (blue signal) showing the brachyury nuclear localization (purple signal). Photomicrographs original magnifications; C, D and E: 100x; F and G: 10X.

