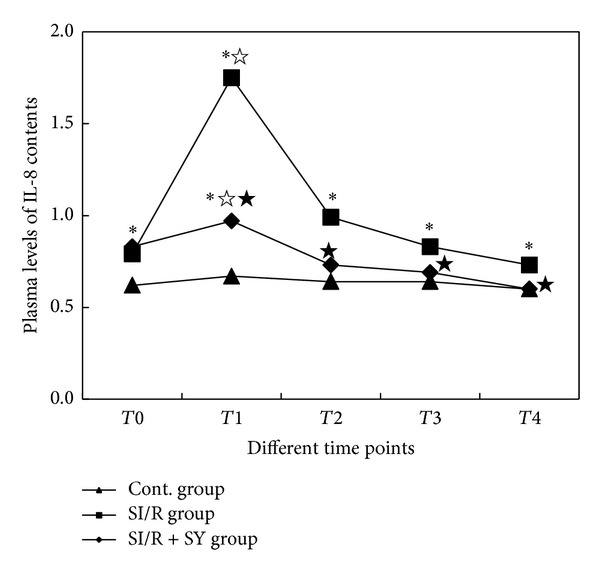
Figure 4.

Changes of plasma IL-8 levels at the different time points. T1: 4 h after reperfusion; T2: 12 h after reperfusion; T3: 24 h after reperfusion; T4: 48 h after reperfusion; Cont, sham control. ∗ indicates comparison with the sham control group at the same time point, P < 0.05;☆ indicates comparison with SI/R group at the same time point, P < 0.05; ★ indicates comparison with T0 in the same group, P < 0.05.
