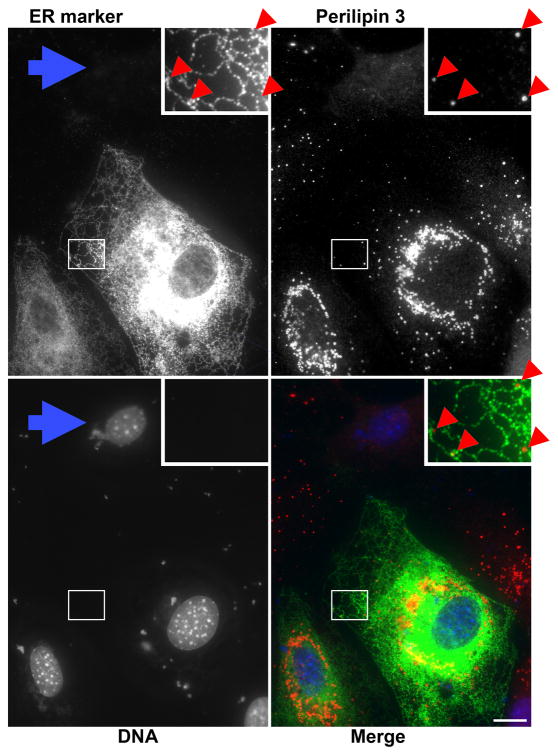
Figure 1. Perilipin 3 falls along the ER at the cell periphery.
OP9 cells were incubated for 1 h with 1.8 mM of the fatty acid oleate bound to albumin at a ratio of 5:1. Cells were fixed and stained for perilipin 3 at 1.6 μg/ml, and the ER was visualized by immunostaining for transfected FLAG-DGAT1 as described previously (Skinner et al., 2009). Bar = 10 micrometers in all figures.

