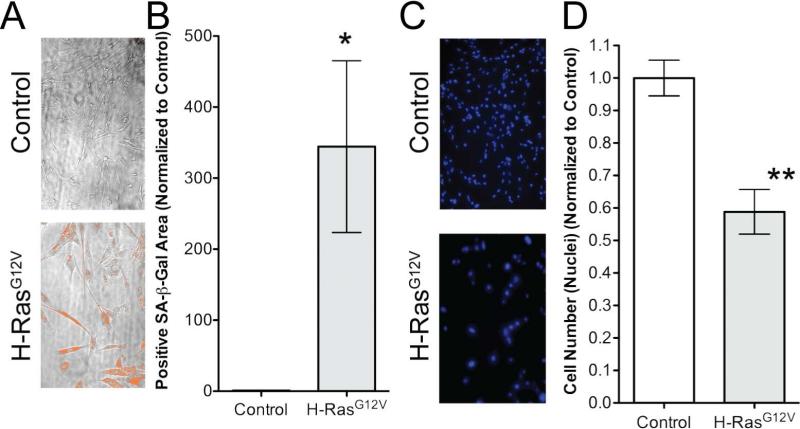
Figure 1. Screen output development.
Using the ImageXpress Micro high-content imaging system, each well was systematically imaged 8 times: 4-bright-field images and 4-fluorescence images. A) Representative bright-field images from screen. Note the “mask” (orange pixels) applied to bright-field images indicating the quantified SA-β-gal positive area. B) Quantification of SA-β-gal positive area between Control and H-RasG12V cells (*p=0.029). C) Representative fluorescence images from screen. D) Quantification of nuclei between Control and H-RasG12V cells (**p=0.0034).

