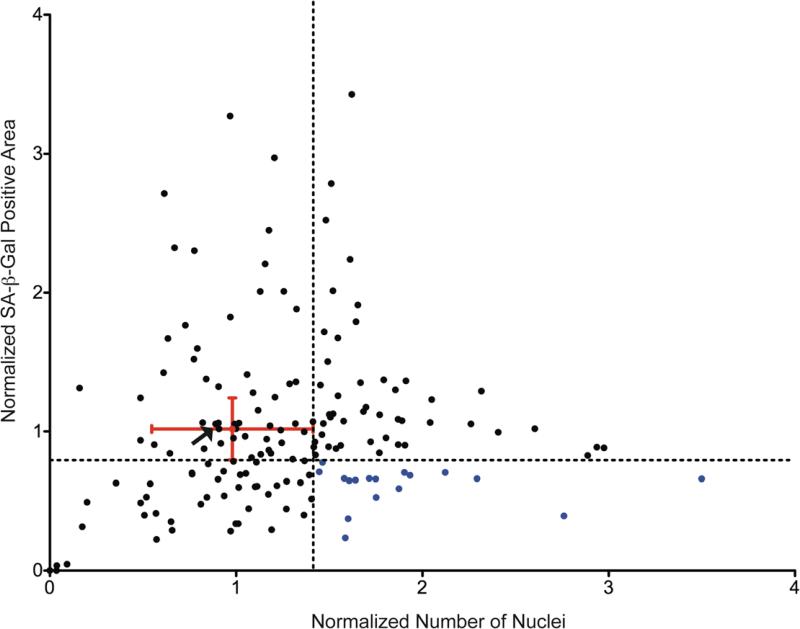
Figure 3. Identification of senescence suppressing kinase inhibitors.
Both the nuclei number and SA-β-gal area were normalized to DMSO-treated control wells (Red dot). The normalized numbers of nuclei (a surrogate of cell number) and SA-β-gal area were graphed. The delineation (dotted lines) separates the graph into quadrants, and placement of the lines was determined from the standard deviation of DMSO control wells (red error bars). The lower right quadrant indicates kinase inhibitors that have significantly more nuclei and less SA-β-gal area (blue dots). Arrow indicates inhibitor used as negative control in subsequent validation experiments.

