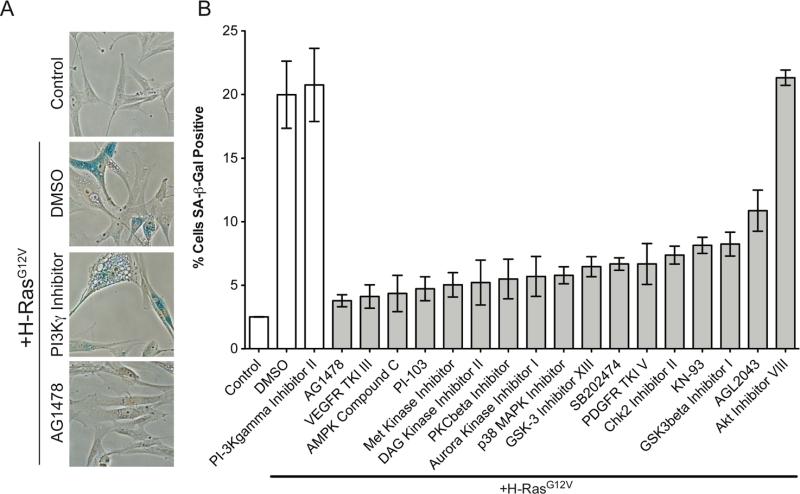
Figure 4. Validation of kinase inhibitors that significantly inhibit SA-β-gal activity.
A) Primary fibroblasts (IMR90) were transduced with a control or H-RasG12V encoding retrovirus. Cells were plated into 6-well plates (15,000 cells/well), selected with puromycin (1μg/mL) for two days and at the end of the second day treated with 250nM of kinase inhibitors. Cells were incubated for seven additional days to allow for senescence and then fixed. SA-β-gal activity was visualized and nuclei were labeled with DAPI. B) Quantification of SA-β-gal positive cells. (300 cells were counted for each of the conditions). Gray bar = experimental conditions and white bars = controls. TKI = tyrosine kinase inhibitor. Average percentages and p-values are in Suppl. Table 2. Experiments were performed in triplicate (Error bars = standard error).

