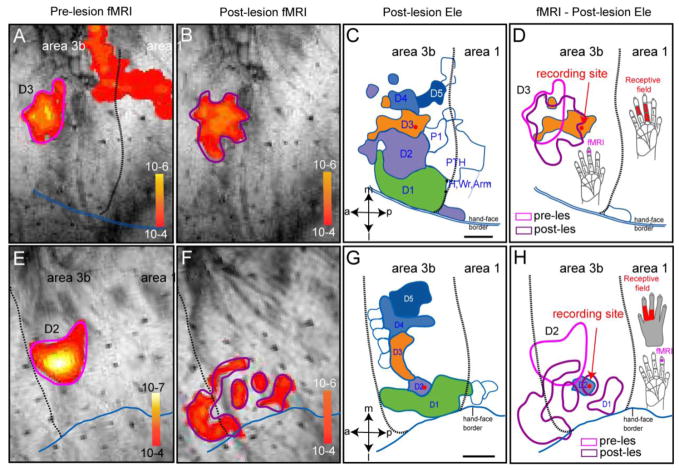
Figure 1. Spatial correspondence of pre-lesion and post-lesion fMRI and electrophysiology maps of input - deprived digit regions in Area 3b in two representative monkeys (SM-D: A–D and SM-C: E–H).
SM-D: (A & E) Pre-lesion fMRI activation map to D3 stimulation (thresholded at p<10−4). Scale bar: p value range for each fMRI image. (B & F) Post-lesion (eight-week) fMRI activation map to same D3 stimulation (thresholded at p<10−4). (C&G) Post-lesion digit representation maps defined by dense microelectrode recording/mapping (detailed map from this animal see Figures in Qi et al 2011). Red dot indicates the recording site from where electrophysiology data (Figures 2 – 5) were taken. Scale bar: 1 mm. a: anterior; p: posterior; m: middle; l: lateral. D1–D5: digits. P1& PTH: palm. Wr: wrist. Dotted black line: border between Area 3b and area 1. Double blue line: hand-face border. (D&H) Spatial relationships among pre-lesion fMRI (pink outline), post-lesion fMRI (purple outline), electrophysiologically defined post-lesion D3 (orange patch), and one of the recording sites (red dot). fMRI activation was generated by the same protocol used in pre-lesion fMRI session (stimulating site on distal finger pad of D3 is shown by the violet dot on hand insert).

