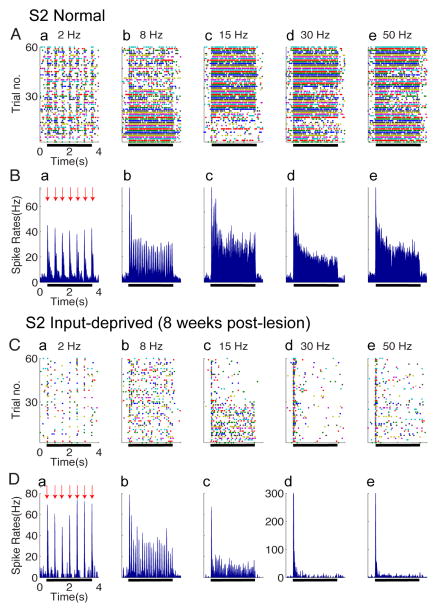
Figure 4. Spiking activity in S2 of normal (A–B) and input-deprived cortex (C–D).
(A & C) Raster plots of typical single neuron spiking responses of S2 in normal (A) and input-deprived (C) cortex. Five columns represent spiking activity recorded from the same site in response to vibrotactile stimuli with various frequencies (from left to right: 2, 8, 15, 30, and 50 Hz). Each row in the raster stands for one stimulus trial (60 trials total), 4.0 s long, and the colored dots represent the action potentials of S2 neurons. Black bars indicate the onset and offset of the stimulus training. (B & D) Peristimulus time histograms (PSTH) plots of corresponding S2 neuron spiking responses in normal (B) and input-deprived cortex (D). Five columns represent spiking activity recorded from the same site in response to vibrotactile stimuli with various frequencies (from left to right: 2, 8, 15, 30, and 50 Hz). All the PSTHs (calculated with 10 ms bin size) ubiquitously exhibited dramatic increase in firing rate at stimulus onset of each trial (indicated by red arrows) and sustained periodic discharge pattern, entrainment to vibratory frequency under control condition.

