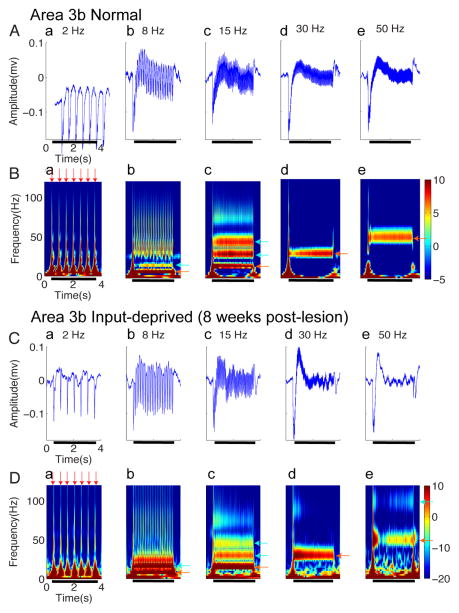
Figure 5. LFPs activity in S2 regions of normal (A–B) and input-deprived cortex (C–D).
(A & C) Plots of somatically evoked local potentials (LFPs) recorded simultaneously from the same electrode as the spikes of (Figure 2A&2C) in normal (A) and input-deprived (C) S2. Five columns represent distinct frequencies of stimuli. Each panel shows typical traces of stimulus-evoked LFP in amplitude (mV), which was averaged from 60 trials within one recording session. Black bars indicate the onset and offset of the stimulus training. (B & D) Corresponding spectrograms of A and C. Each panel shows response of stimulus-evoked LFP in the time-frequency domain decomposed by the wavelet transform (averaged from 60 trials within one recording session). The spectrograms show that the ON responses consist of a wide band of frequencies (red arrows), and bands at the stimulus frequencies as well as higher harmonics occur during the stimulation epoch (light blue arrows). The color bar shows the LFP power in dB unit.

