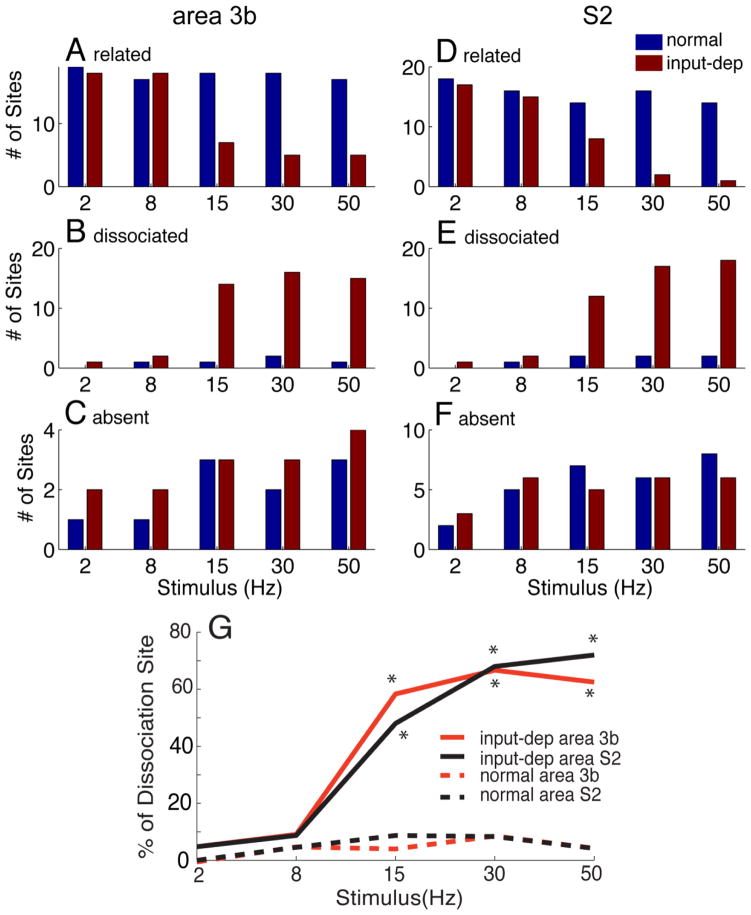
Figure 7.
Plots of the number of penetrations of related (A, D), dissociated (B, E) and absence (C, F) of spiking activity and LFP power as a function of different stimulus frequencies in control (blue bars) and plasticity (input-deprived, red bars) cortex of area 3b and S2. (G) Summary of spike-LFP dissociation as function of stimulus frequency in area 3b and S2 of normal and input-deprived (plasticity subjects). With increasing stimulation frequency, the LFP response became more frequently dissociated with spiking activity in plasticity cases, which was quantified by the percentage of total recording sites (red line: from 4.8% to 62.5% of recording sites in area 3b and dark line: from 4.8% to 72.0% in S2). Particularly at higher frequencies of stimulation (15, 30, 50 Hz), the numbers of recording sites where the dissociation were robustly observed in plasticity cases is significantly higher than those in control cases (dash lines).

