
Figure 5.
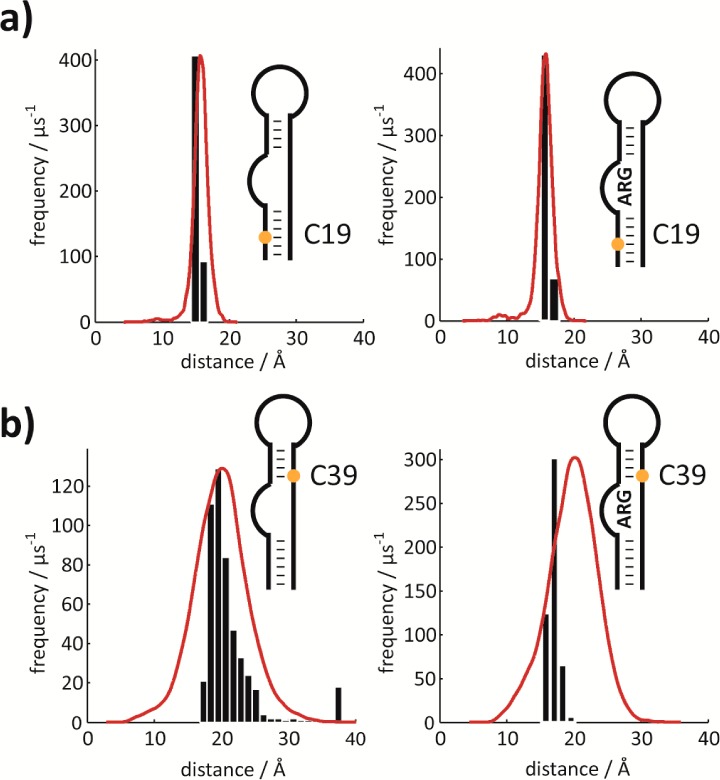
Comparison of MD/PRE derived distances. Comparison of histograms from MD simulations (red lines) with experimentally determined PRE derived distances (based on Monte Carlo simulations, black bar plots) of two representative nucleotides. (a) Results for C19 in free (left) and in the argininamide bound (right) state. (b) Results for C39 in free (left) and in the argininamide bound (right) state. Each histogram was constructed with the number of bins adjusted to the width of the sampled distances so as to give bars of the same width. The maxima of the MD distance distributions are normalized with respect to the maxima of the experimental distance distributions. Note that the distributions from the MD trajectory correspond to states that are actually sampled, whereas the distributions of experimental data are merely experimental errors of the mean values based on the signal-to-noise ratio in the spectra. Experimentally derived distances are a function of PRE–1/6 resulting in a slight skew toward higher values even if PREs are equally distributed (simulations not shown).