Figure 4.

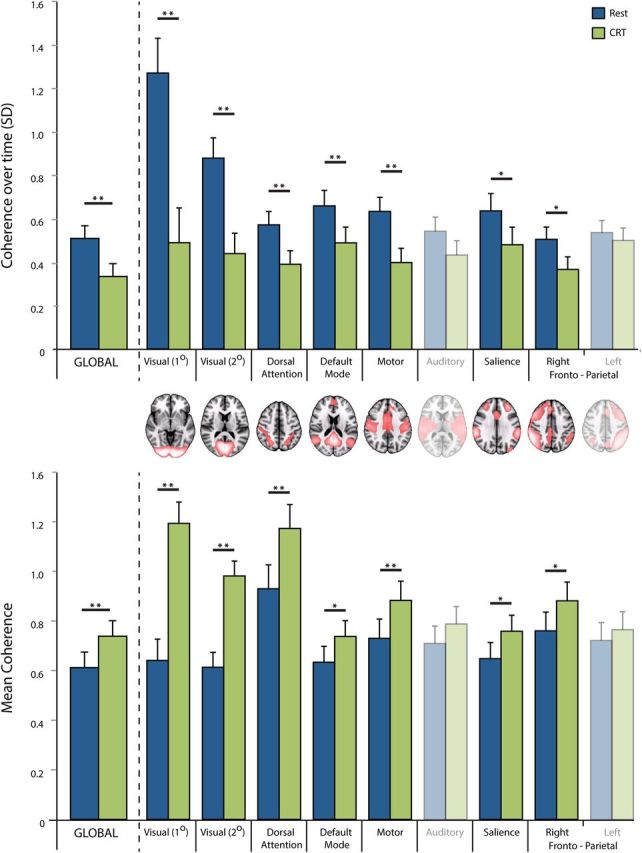
Measures of variability in coherence over time (top) and mean coherence (bottom) between CRT (in green) and rest (in blue), for continuous BOLD fMRI data. Single asterisks show differences that are statistically significant at p < 0.05 (two-tailed t test); double asterisk is significant at p < 0.01; n = 16. Error bars indicate ±1 SEM.
