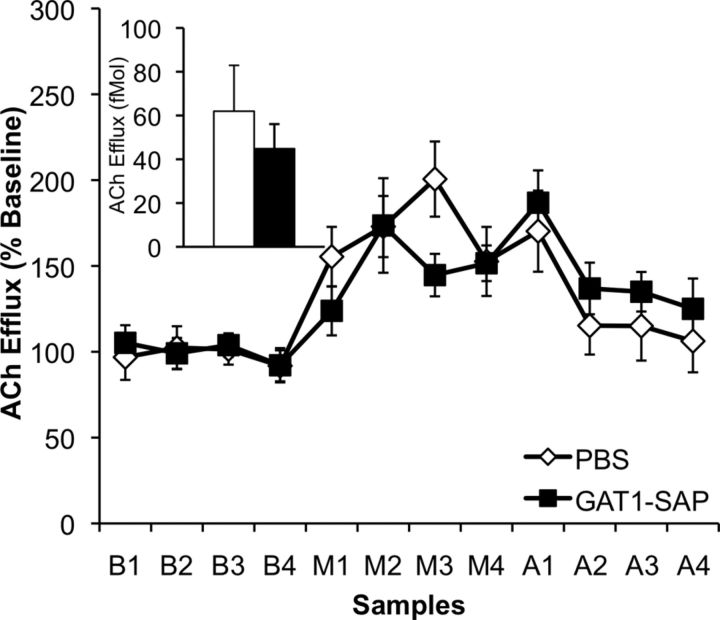
Figure 2.
Profile of hippocampal ACh efflux (percentage of baseline average; mean ± SEM) in PBS- and GAT1-SAP-treated animals; inset displays average basal hippocampal ACh efflux (fmol) in both groups. Both groups had an increase in exploration-evoked hippocampal ACh efflux (M samples) above their own baselines (B samples). However, MSDB GAT1-SAP treatment did not change basal or exploration-evoked hippocampal ACh efflux (A samples = post-maze phase).

