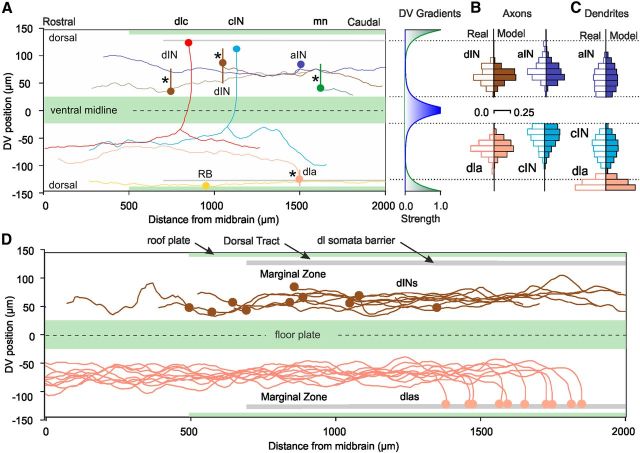
Figure 3.
The 2D CNS growth environment with modeled axons and match to real axons. A, 2D plan with examples of real measured axons for each neuron type. Circles show positions of somata and vertical bars show simplified dendrites for 4 neurons (*). The form of the exponential DV gradients is shown at right (dorsal gradient is green, ventral, blue). B, C, Histograms comparing DV distributions of real (measured, open bars) and model (solid bars) axons and dendrites (10 μm bins show proportions) for aINs, cINs, dINs, and dlas. Note that sensory pathway dla dendrites extend into dorsal tract. D, Examples of modeled axon trajectories of dINs and dlas (cf. Fig. 2H).

