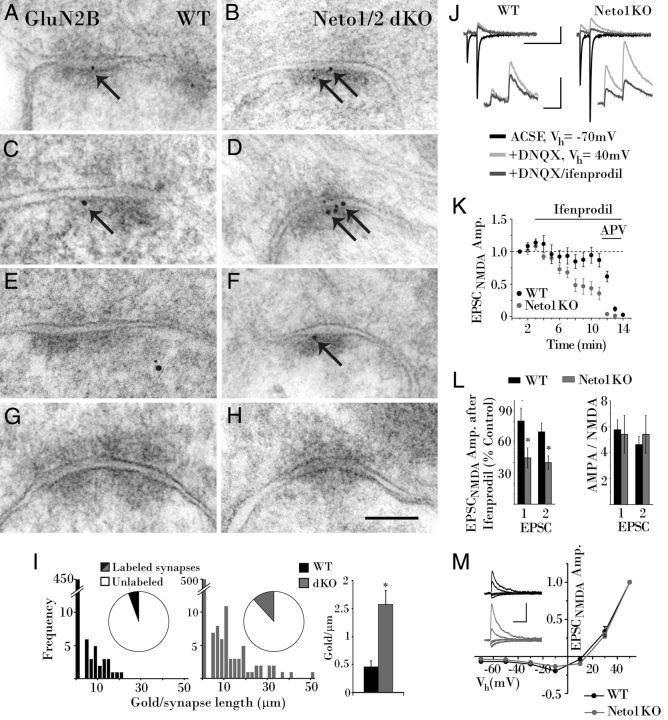
Figure 4.
GluN2B expression is increased at MF–CA3 synapses in the absence of Neto interactions. A, C, E, G, Colloidal gold (arrow) labels rare postsynaptic GluN2B at an MF–CA3 synapse in a WT mouse, as well as synapse-adjacent (C, arrow) and cytoplasmic GluN2B (E), leaving most synapses unlabeled (G). B, D, F, H, In Neto-null mice Immunogold particles (arrows) label postsynaptic GluN2B more robustly (B, D, F), while unlabeled synapses are also evident (H). I, However, a larger portion of synapses are labeled in Neto-null mice, and with greater abundance, combining to increase the average density of postsynaptic gold threefold. J, Greater ifenprodil inhibition of evoked MF–CA3 EPSCNMDAs (20 consecutive events averaged) in Neto1KO than WT mice. K, Time course plot (1 min running averages normalized to the first minute) illustrating the effects of ifenprodil on the peak amplitude of EPSCNMDA in Neto1KO (n = 6) and WT cells (n = 9). L, Histogram summaries for the effects of ifenprodil on EPSCNMDA, and AMPA/NMDA ratios, in WT and Neto1 knock-out mice. Residual EPSCNMDA following ifenprodil application is expressed as a percentage of control EPSCNMDA measured immediately before ifenprodil application. M, MF–CA3 synapse NMDA I–V curves with representative traces (insets) for WT (n = 7) and Neto1 knock-out (n = 7) cells. EPSCNMDA peak amplitudes at each holding potential are normalized to the amplitude obtained at a Vh = +50 mV. Scale bar: A–H, 100 nm. Calibration: J, K, 200 ms, 200 pA; insets, 50 ms, 100 pA; M, 100 ms, 100 pA. *p < 0.05. dKO, Double KO.

