
Figure 4.
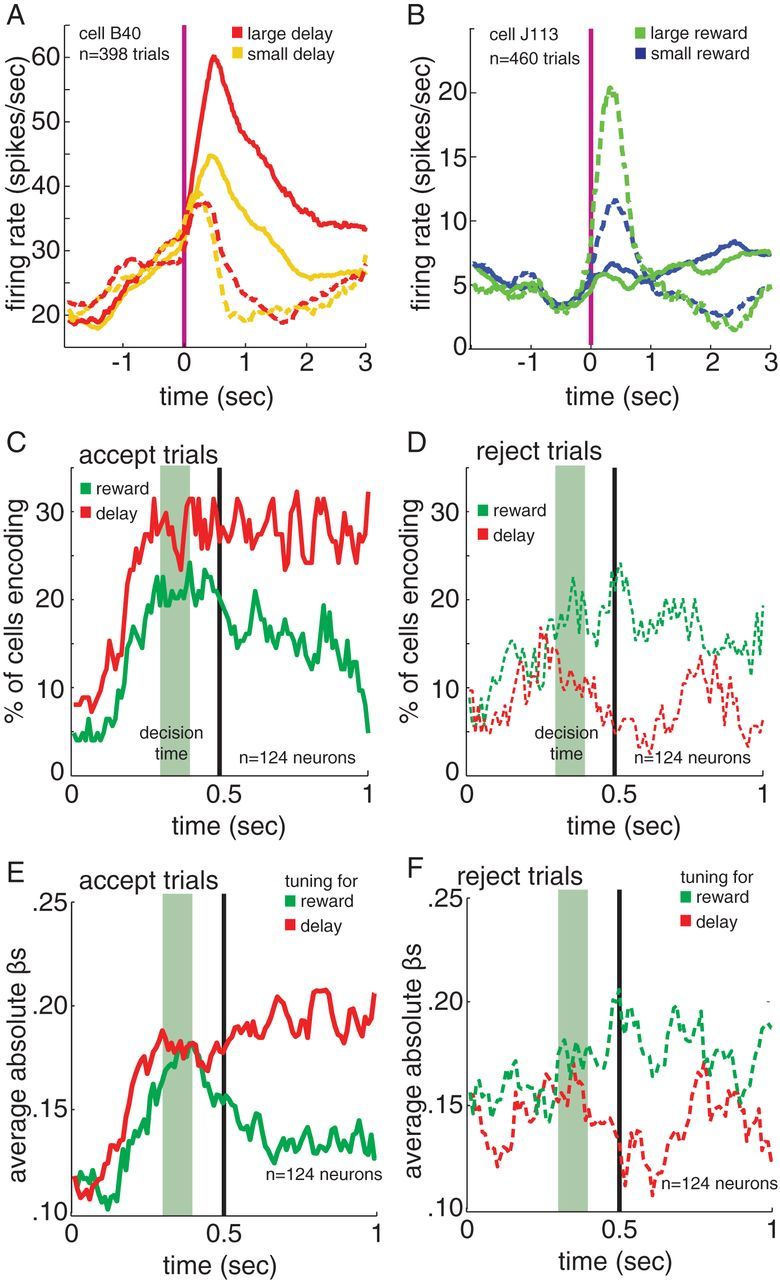
On accept trials neurons are biased toward encoding delay, on reject trials neurons are biased toward encoding reward size. A, B, Average trial onset-aligned firing rates from example neurons. Solid lines indicate accept trials, dashed indicate reject trials. Example cells show, A, sensitivity to delay size during accept trials but not reject trials, and B, sensitivity to reward size on reject trials but not accept trials. Vertical red line indicates option onset. C, D, The percentage of neurons encoding reward (green) and delay (red) on C, accept trials and D, reject trials. In all cases, time 0 indicates time of option onset. E, F, The average strength of the regression coefficients for reward and delay, separated by E, accept trials and F, reject trials. In all cases, a plotted dashed line refers to reject trials and solid refers to accept trials. Sliding boxcar analysis: window size is 100 ms, time 0 is the time of option appearance, and the green area indicates our best estimate of when the decision it being made. Green area indicates estimated decision time. Vertical black line indicates 0.5 s, the beginning of the 500–1000 ms epoch analyzed and detailed in the text.