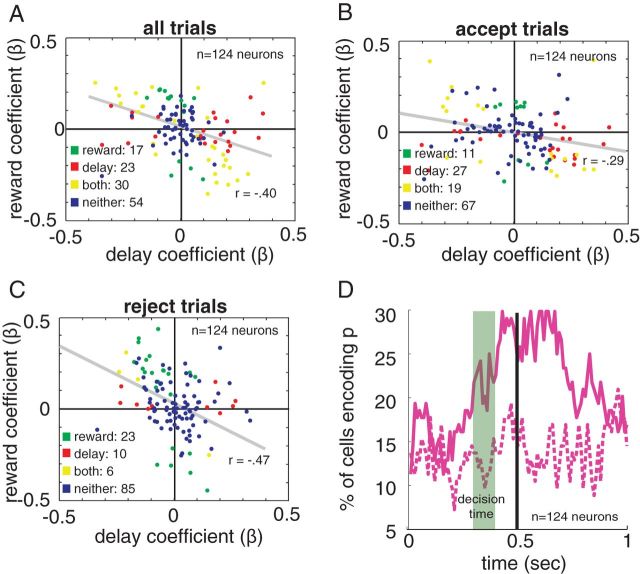
Figure 6.
Neurons encode profitability. A–C, Delay regression coefficients for each neuron plotted against that neuron's reward-size regression coefficient. The encoding of reward and delay are negatively correlated. Each point indicates an individual neuron's response to delay and reward; a negative coefficient means lower firing rate for higher values of the given variable. Points are color coded to indicate whether they reach significance (p < 0.05) for encoding of reward (green), delay (red), both (yellow), or neither (blue). Gray line indicates best-fit line. Showing data for A, all trials, B, accept trials, and C, reject trials. D, Percentage of neurons that have a significantly better fit with profitability added to the regression model than without.

