
Figure 7.
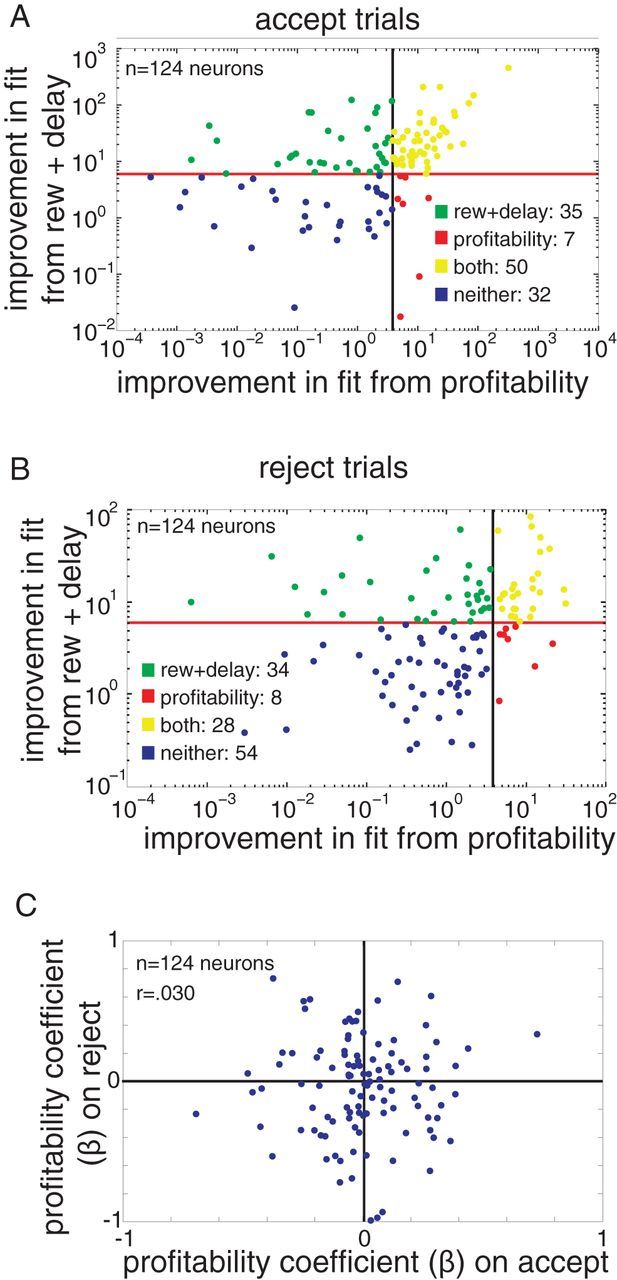
Profitability overlaps with reward size and delay encoding, and encoding is different on accept versus reject trials. A, B, The improvement in fit (as measured by difference in deviance) from adding profitability to a model including reward size and delay, plotted against the improvement of fit in adding reward size and delay to a model including only profitability, for A, accept trials, and B, reject trials. Lines indicate value required to reach significance. Points are color coded to indicate whether they reach significance (p < 0.05) for significant improvement in fit from adding reward size and delay (green), profitability (red), both (yellow), or neither (blue). C, The regression coefficient for each neuron on accept trials plotted against its regression coefficient on reject trials. There is no significant correlation.