Figure 2.
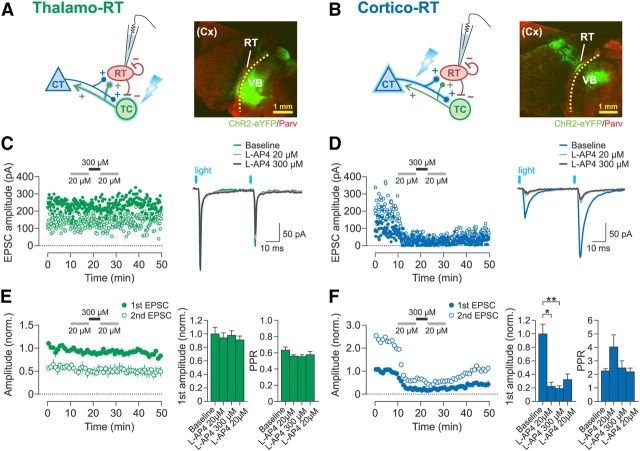
Activation of group III mGluRs depresses cortico-RT synapses but not thalamo-RT synapses. A, B, Experimental schematic and examples of horizontal thalamic slices from brains with ChR2 expressed in VB thalamus (A) or barrel cortex (B). RT shows relatively dense parvalbumin expression. Dotted line denotes location of scalpel cut between RT and VB. Barrel cortex is outside of the plane of section. C, D, Representative recordings of EPSCs in patched RT neurons evoked by optical paired-pulse stimulation (25 Hz) of thalamo-RT (C) or cortico-RT (D) axons during bath application of l-AP4. Left, Time course of changes in peak amplitude of first EPSC (filled circles) and second EPSC (open circles). Right, Averaged sample traces of EPSCs from the experiment plotted on left. E, F, Summary data for effect of l-AP4 on EPSC amplitude. Left, Time course of changes in mean peak amplitude normalized to mean baseline amplitude of first EPSC. Right, Bar graphs of normalized first EPSC amplitude and PPR. Data are from the last 2 min of each drug epoch. Thalamo-RT (E) first EPSC amplitude was not affected by l-AP4 (n = 6, F(3,15) = 1.52, p = 0.25, one-way rANOVA), and PPR also was not affected (F(3,15) = 1.64, p = 0.22). Cortico-RT (F) first EPSC amplitude was decreased by l-AP4 application (n = 5, F(3,12) = 38.03, p < 0.0001, one-way rANOVA), but PPR was unaffected (F(3,12) = 2.30, p = 0.13). Baseline epoch: min 0–10. *p < 0.05; **p < 0.01, Tukey's post hoc test.

