
Figure 3.
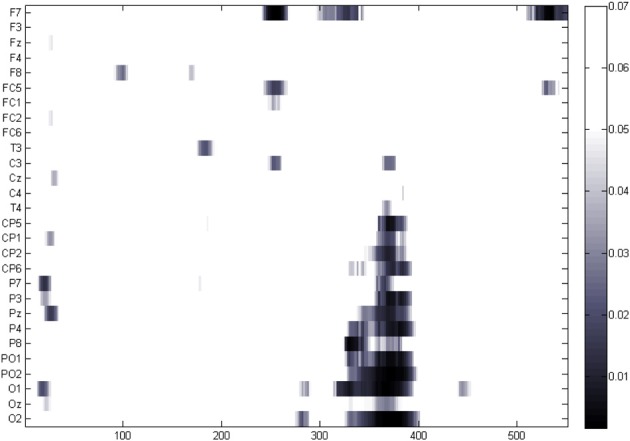
P-values resulting from the paired t-test (FDR corrected) at each sampling point. Colored points correspond to those p-values below 0.05.
Official websites use .gov
A
.gov website belongs to an official
government organization in the United States.
Secure .gov websites use HTTPS
A lock (
) or https:// means you've safely
connected to the .gov website. Share sensitive
information only on official, secure websites.
P-values resulting from the paired t-test (FDR corrected) at each sampling point. Colored points correspond to those p-values below 0.05.