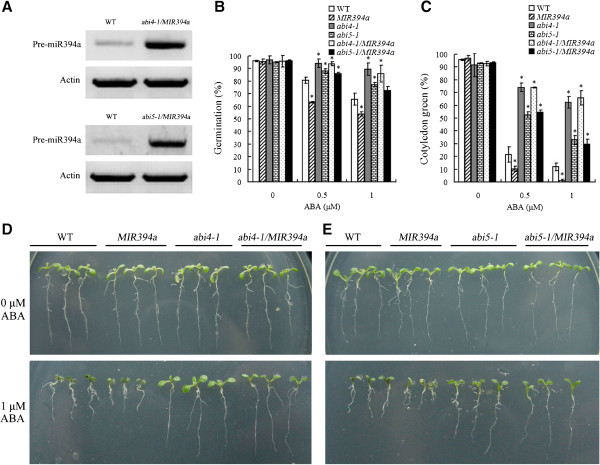
Figure 9.
Phenotypical analysis of the cross lines of abi4-1/MIR394a (or abi4-1/35S::MIR394a) and abi5-1/MIR394a (or abi5-1/35S::MIR394a) with ABA. A: RT-PCR analysis of in pre-miR394a expression in the two week-old abi4-1/MIR394a and abi5-1/MIR394a plants. B/C: Analysis of germination rates and cotyledon greening. Seeds of the indicated plants were germinated and grown for 4 (B) or 7 (C) d on plates containing 0, 0.5 and 1 μM ABA. After that, seed germination and cotyledon greening were determined. D/E: Root growth of the indicated plants on the MS medium with 0 or 1 μM ABA. The phenotypes were photographed 10 d after germination. For 35S:MIR394b plants, similar results were found (data not shown). Vertical bars represent standard deviation of the mean (n =3, treatments with 60 seedlings). Asterisks indicate the significant difference between the transgenic lines/mutants and wild-type (WT) (P<0.05).

