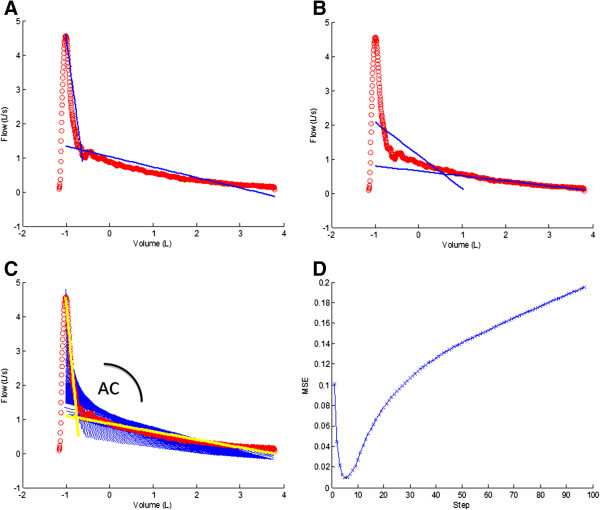
Figure 1.

Example of the calculation process with fitting of regression lines to the original data in incremental steps of 10 data points. Panels A-B show regression lines for a candidate reference point after respectively 10 and 400 data points. Panel C shows all regression lines together with a highlighted selection of 2 lines in yellow (after 6 steps) having the lowest MSE of all steps, as represented in Panel D.
