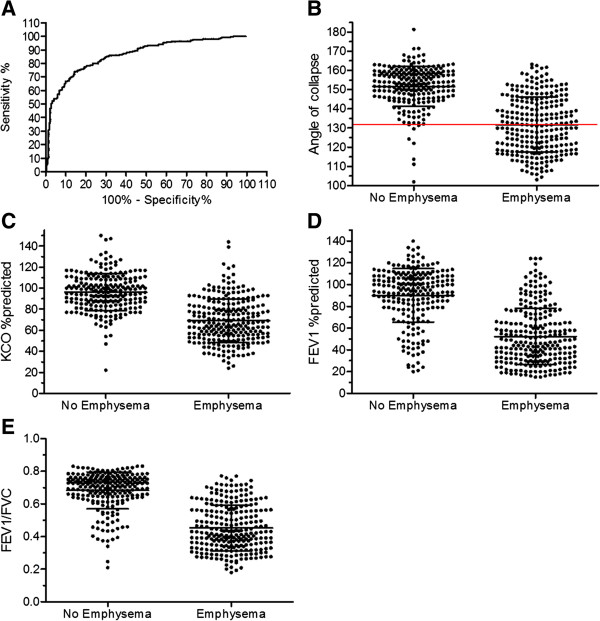
Figure 3.

Receiver operating characteristic (ROC) curve analysis. Panel A/ ROC curve of AC to diagnose emphysema. Panels B-E/ Scatter graph of different variables within emphysema subjects and non-emphysema subjects. The horizontal line represents the best cut-off for sensitivity-specificity.
