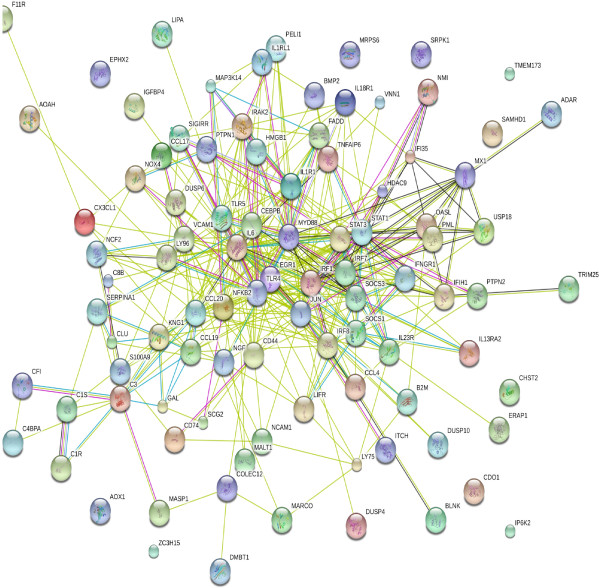
Figure 4.
STRING analysis of the relationship between DE genes related to innate immune response, cytokine-mediated signaling pathways, and inflammatory response related genes. The network nodes represent the proteins encoded by the DE genes. Seven different colored lines link a number of nodes and represent seven types of evidence used in predicting associations. A red line indicates the presence of fusion evidence; a green line represents neighborhood evidence; a blue line represents co-ocurrence evidence; a purple line represents experimental evidence; a yellow line represents text-mining evidence; a light blue line represents database evidence, and a black line represents co-expression evidence.

