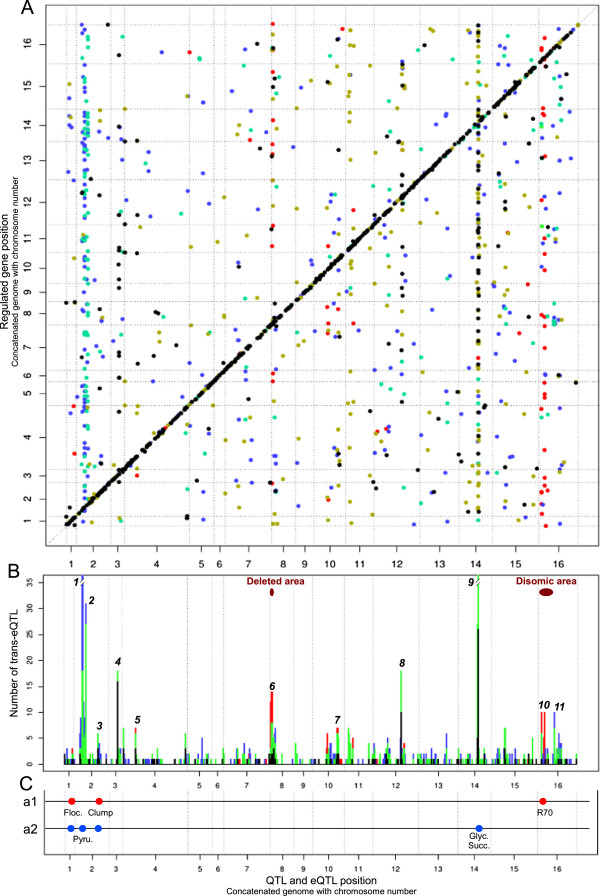
Figure 4.
QTL and eQTL localization. (A) Localization of the 1465 eQTLs in function of the corresponding transcript position. Colors correspond to the group in the Venn diagram Figure 3B. Spot in the first diagonal correspond to cis-eQTLs. (B) Trans-eQTL density and formation of hotspot. Descriptions of each hotspot are in Table 1. Black peaks correspond to the trans eQTL in common of the 3 analyses, Green peaks correspond to trans-eQTL detected at least in analysis 3. Blue peaks correspond trans-eQTL specific of analysis 2. Red peaks correspond trans-eQTL specific of analysis 1. (C) Phenotypic QTLs detected with 44 segregants (a1, red) and with 31 segregants (a2, blue).

