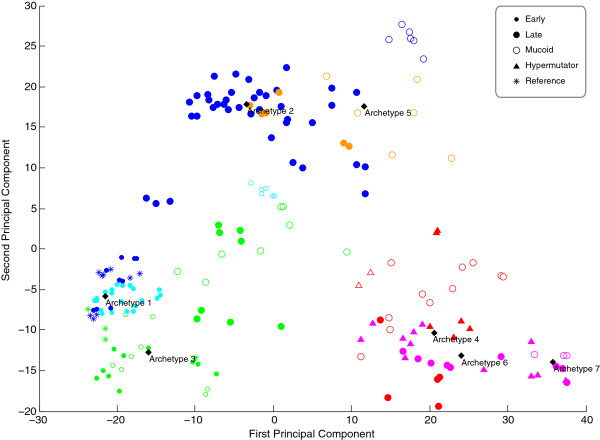
Figure 7.
Principal component analysis scatter plot. Each sample is plotted with respect to the loadings of first and second PCA component. The seven archetypes from archetypal analysis are transformed into the PCA space through a basis transformation. Each Study is indicated with a specific color. Study 1: GREEN, study 2: CYAN (samples #48-74) and BLUE (samples #75-128), study 3: RED, study 4: MAGENTA, study 5: ORANGE. The phenotypes are indicated with symbols as “Early”, “Late”, “Mucoid” and “Hypermutator”. The reference strains PAO1 and PA14 from study 1 and 2 are indicated with a symbol as “Reference”.

