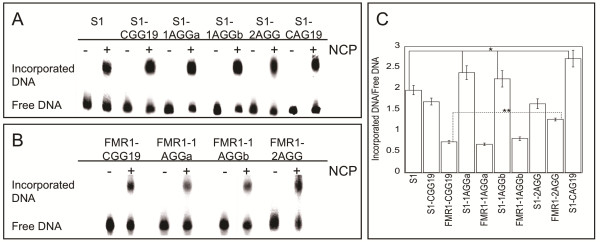
Figure 2.

Representative competitive nucleosome incorporation reactions. To analyze the ability of each substrate to incorporate into a nucleosome, competitive nucleosome incorporation assays were performed under equilibrium conditions and the products of the reaction were resolved by native PAGE. An incorporation performed in the absence of chicken nucleosomes (NCP) (−NCP) and an incorporation performed in the presence of NCP (+NCP) are shown. The incorporation assays with the S1 series of substrates are shown in panel A and the incorporation assays with FMR1 series of substrates are shown in panel B. By quantifying the amount of radioactivity in both the incorporated DNA and free DNA bands, the ratio of incorporated DNA to free DNA was calculated for each substrate and is shown in panel C. The error bars represent the standard error for each substrate. Data represent a total of three biological replicates per substrate, each consisting of three technical replicates, for nine total values. The standard used for statistical comparison of the S1 series was the S1 substrate while the FMR1-CGG19 was used as the standard for statistical comparison of the FMR1 series. *p ≤ 0.05, **p ≤ 0.005 by Student’s T-Test.
