Figure 1.

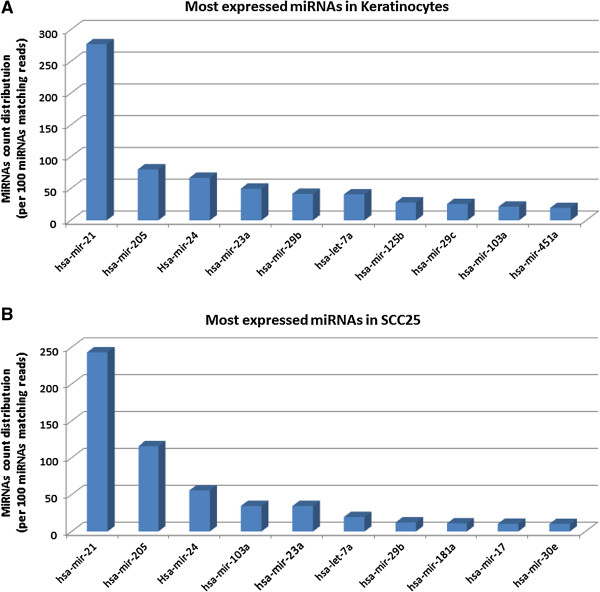
Histogram indicating the expression levels of 10 most represented miRNAs in both datasets. (A) 10 most expressed miRNAs in keratinocytes; (B) 10 most expressed miRNAs in the cell line (SCC25).

Histogram indicating the expression levels of 10 most represented miRNAs in both datasets. (A) 10 most expressed miRNAs in keratinocytes; (B) 10 most expressed miRNAs in the cell line (SCC25).