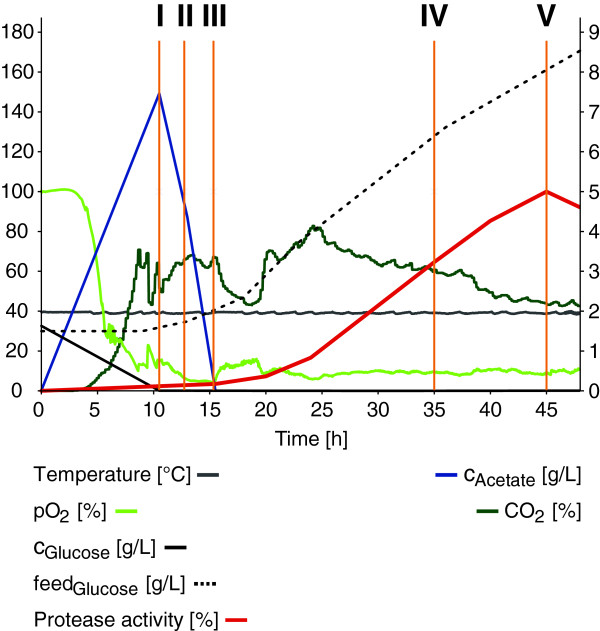
Figure 1.
Protease production and process parameters. Process parameters are shown for fermentation L (the parameters for the replicate fermentations R and M are corresponding, data not shown). Temperature T [°C], oxygen partial pressure pO2 [%], glucose concentration cGlucose [g/L], supplied glucose feedGlucose [g/L] and normalized protease activity [%] are displayed on left y-axis, whereas acetate concentration cAcetate [g/L] and carbon dioxide content CO2 [%] are scaled on the right y-axis. Process time t [h] is given on the x-axis. The sampling points I to V are indicated by orange lines.

