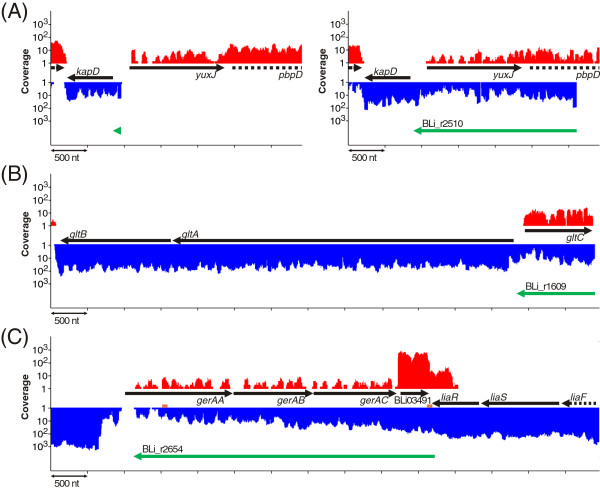
Figure 6.
Untranslated regions (UTRs). Transcriptional activities of UTR regions. Black arrows indicate genes and green arrows the identified UTRs. (A) 5’UTR of kapD at sampling point II (left) and sampling point IV (right). (B) 5’UTR BLi_t1609 at sampling point IV. (C) 3’UTR BLi_r2654 (pooled RNA-Seq data). Predicted terminator sequences are marked orange.

