Fig. 1.
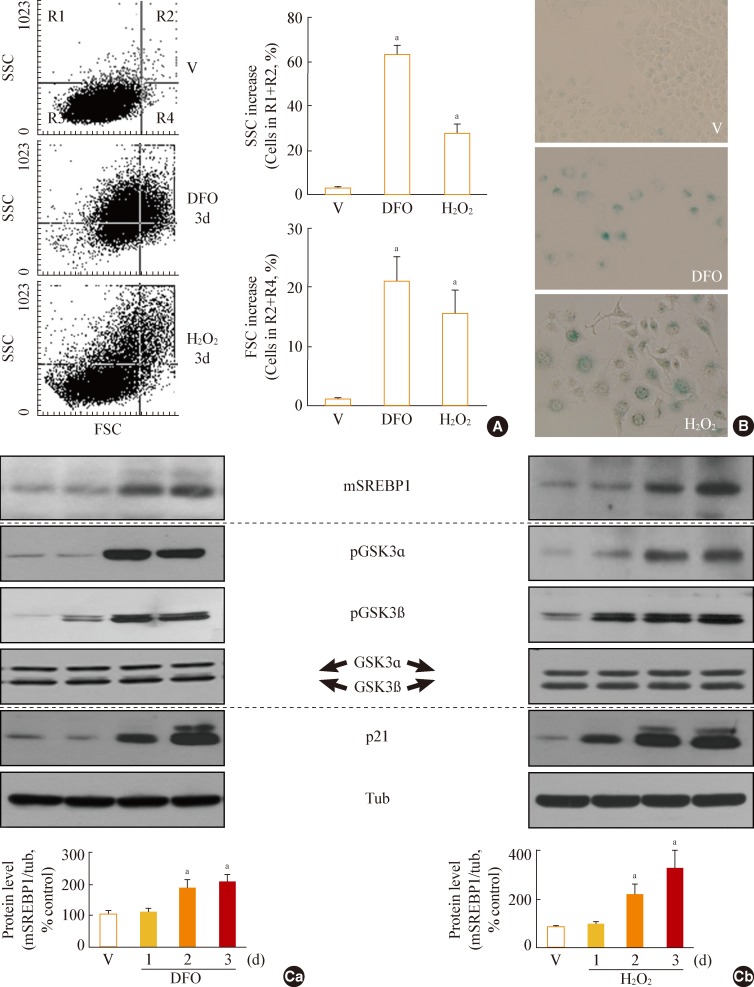
Increase in glycogen synthase kinase 3 (GSK3) phosphorylation and mature sterol regulatory element binding protein 1 (SREBP1) in stress-induced senescence. Chang cells were treated with 200 µM deferoxamine (DFO) or H2O2 for the indicated periods. Dimethyl sulfoxide (DMSO) was used as vehicle control (V). (A) Flow cytometric analysis of the cell distribution after treatment of the stressors (200 µM DFO or H2O2) for 3 days. Cell size and cell granularity were analyzed by comparing forward scatter (FSC; R2+R4) and side scatter (SSC; R1+R2). Representative profiles (left) and their analyses for cell granularity (SCC analysis, right upper) and cell size (FSC analysis, right lower) are shown. (B) Representative images of senescence-associated β-galactosidase-positive cell populations are shown. (C) Western blot analysis. Quantitative analyses of the expression levels of SREBP1 mature form are shown in the lower panels. mSREBP1, mature-form SREBP1; pGSK, phosphor-GSK. aP<0.01 vs. V (DMSO control).

