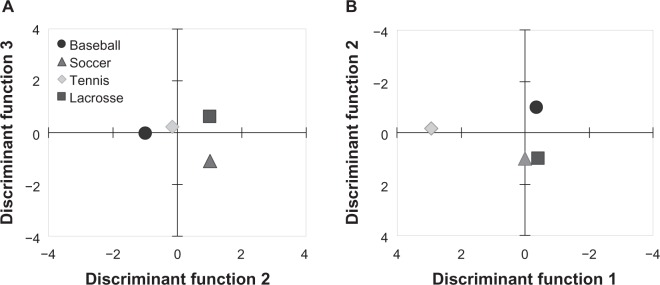
Figure 3.

The two-dimensional projection plots of the group centroids.
Notes: The two-dimensional projection plots of the group centroids. (A) the two-dimensional projection of discriminant function 2 and 3. (B) the two-dimensional projection of discriminant function 1 and 2. ○, baseball; △, soccer; ◊, tennis; □, lacrosse.
