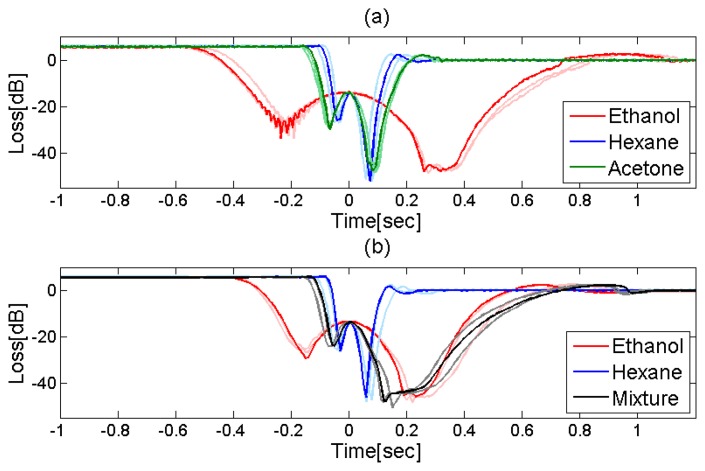
Figure 9.
Experimentally measured, relative transmission power losses as a function of time, recorded during the evaporation of acetone (green), ethanol (red), hexane (blue), and a 1:1 mixture of ethanol and hexane (black), from within a fiber MC. Colors relate to both panels. In order to facilitate a comparison between the loss transients of different solvents, the origin t = 0 for each curve was arbitrarily chosen as the instance of the local maximum transmission, which occurs during each loss event.

