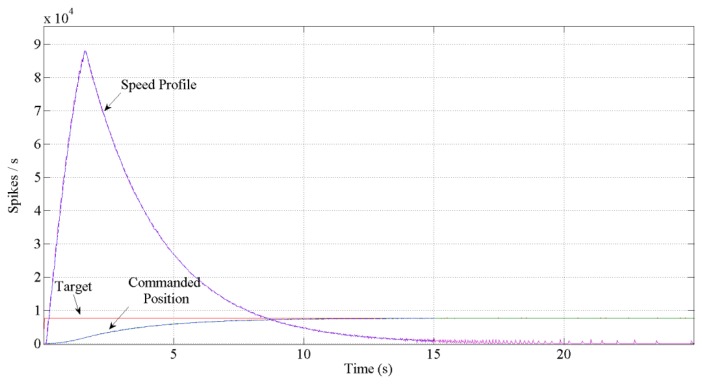
Figure 13.
Performance achieved corresponding to ten percentage slope in GO signal. Dotted lines are simulated in front of measurement solid lines. The bell shape profile signals represent the speed. The ripple in the spike-base behavior is due to the function that transforms the spikes into a continuous signal. The target is the same for both simulated and measurements signals and it is represented as a firing rate. It takes a total of 12 s to reach the target if we look through the position.

