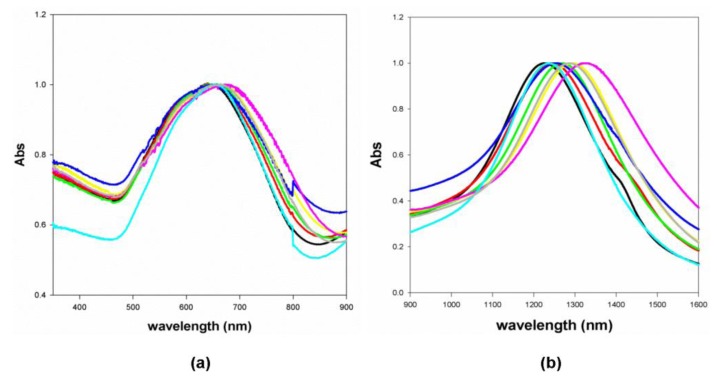
Figure 7.
Normalized absorption spectra (a: LSPR2, b: LSPR3) of GNS suspended in different solvents. Black: water (n = 1.3300); light blue: acetonitrile (n = 1.3442); red: ethanol (n = 1.3611); blue: ethyl acetate (n = 1.3723); green: n-butanol (n = 1.3990); grey: N,N-dimethylformamide (n = 1.4300); yellow: chloroform (n = 1.4476); magenta: toluene (n = 1.4961).

