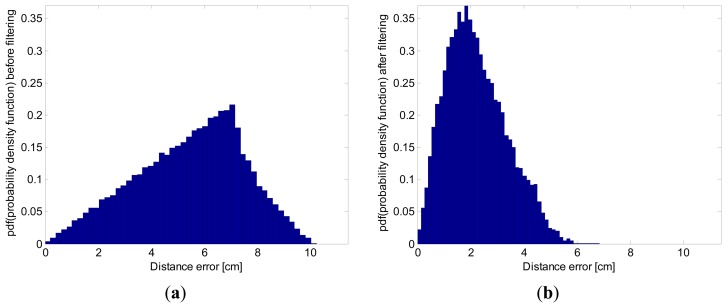
Figure 11.
Histogram of distance errors, with 5 Hz update rate, using the simulations along the 18 straight lines shown in Figure 7a. (a) before applying the Kalman filter; (b) after applying the Kalman filter. The histogram has been normalized so that it has a unitary area, representing an approximation to the probability density function (pdf) of the distance errors statistical random variable.

