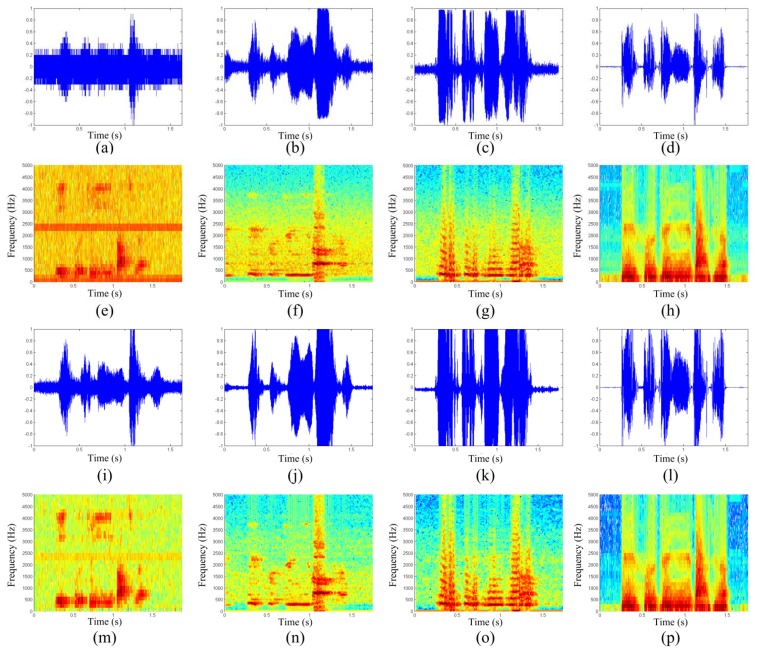
Figure 3.
The time-domain waveform and the spectrogram of a typical speech material. The four figures of each column are corresponding to microphone speeches (first column), 34-GHz simple radar speeches (second column), 34-GHz superheterodyne radar speeches (third column), and the 94-GHz quadrature superheterodyne radar speeches (fourth column). The first two rows are corresponding to the original speeches, the other rows are corresponding to the enhanced speeches.

