
Figure 5. Accumulation levels of DREB2A protein in drip1 and drip1 drip2 mutants subjected to dehydration and heat stress.
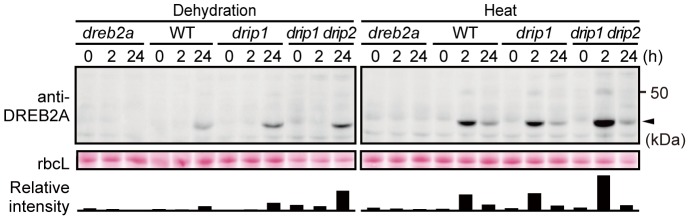
Three-week-old WT, dreb2a-1, drip1 and drip1 drip2 seedlings were subjected to either dehydration (left panel) or heat stress (right panel). Accumulation levels of the DREB2A protein were determined by immunoblot analysis using the anti-DREB2A antibody. The arrowhead indicates the major band of DREB2A; rbcL bands visualized by Ponceau S are shown as loading controls. The bars below the bands show the intensity of the DREB2A band relative to the corresponding rbcL band in each lane.