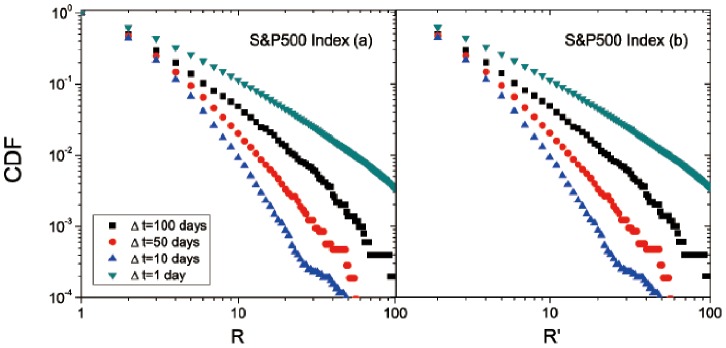
Figure 3. CDFs of (a) R and (b) R′ for different time intervals, ΔT, for the S&P500 Index in the US stock market.

Each curve can be fitted with a power law, as indicated by the straight line in the log-log plot. Regarding the fitting, more details are listed in Table 2.
